Written by: Mark Pryer, Senior Applied Performance Coach
Key Points:
- Quantifying jump testing through force plates is a simple way to parse out metrics (such as Reactive Strength Index–or RSI) that can be used to determine the most impactful way to program for the athlete, based on the measured decrements in performance.
-
What does this mean for you? Here at ATH we are able to test any athlete that walks through the door using this technology and produce a streamlined report that our coaching staff can walk you through in detail. This allows us to give the coach or practitioner concrete evidence to help guide programming decisions that will be effective and time efficient. Contact us to learn more and get started today.
Introduction
In a previous post, we covered jump training and a few of the multitude of reasons why as a characteristic in human performance the underpinnings of ballistic force production are worth honing in on. In addition, we briefly described the mechanistic factors at play that make the expression of force a quality worth digging a little bit deeper in order to give more than just a surface-level view of these wholly trainable attributes.
Read Jump Training the ATH Way blog post.
The purpose of this article is to describe and begin to show how we as a coaching staff can collect, interpret and quantify the output of the athlete’s jump capabilities by using a series of jumps, force plates and testing software. This allows us to begin to determine the appropriate jump training methodology for customizing training load based on the results. In this article we will describe 3 types of jumps (countermovement jump (CMJ), repeat countermovement jump (3 CMJ), and Stiffness Jump (STJ)), and the relative importance of each.
Discussion
What is a force plate?
A force plate, or force platform as it’s sometimes called, is a piece of equipment that is commonly used in research and sports science. During human movement force is expressed in all directions in order to propel the human body through space. These force plates are used in order to allow the scientist, coach and researcher to better understand how forces are being exhibited in a dynamic movement (jumping, running, landing etc) in order to quantify performance variables. For our purposes and the scope of this article we will be talking about common metrics such as reactive strength index, flight time and ground contact time.
CMJ Trace interpretation basics
In the previous article we touched on the 3 component model, a standard physiological model that delineates different parts of the connective tissue based on structure and function. If needed as a refresher feel free to revisit the previous article here. In the 3 component model we have the SEC (Tendon), PEC (Fascial System) and CC (Muscle). Depending on the type of jump employed and the length of ground contact, differing systems are at play and can contribute more or less to performance. Jumping and plyometric activities are typically classified based on the ground contact time elicited during performance. The two categories are fast and slow stretch shortening cycle (SSC), with fast SSC activities lasting under .25s and slow above .25s. We will go over both within this article, and begin to describe the differences for each in addition to how each fits within an athlete’s movement profile.
First, we will touch on the countermovement jump as it’s one of the most common ways to quantify performance. Due to the slower (relatively speaking) time to peak force and ground contact time the CMJ is classified as a slow SSC jump. At first glance the force trace from a countermovement jump can be like trying to read a sign in a foreign language. You know there’s information being presented to you, but unless you know what you’re reading it might as well be greek. Let’s briefly go over how this information is interpreted.
This is an example of a CMJ force trace, there is a wealth of information presented as long as you know what to look for. Let’s start at the beginning, and we’ll hit the key parts (3).
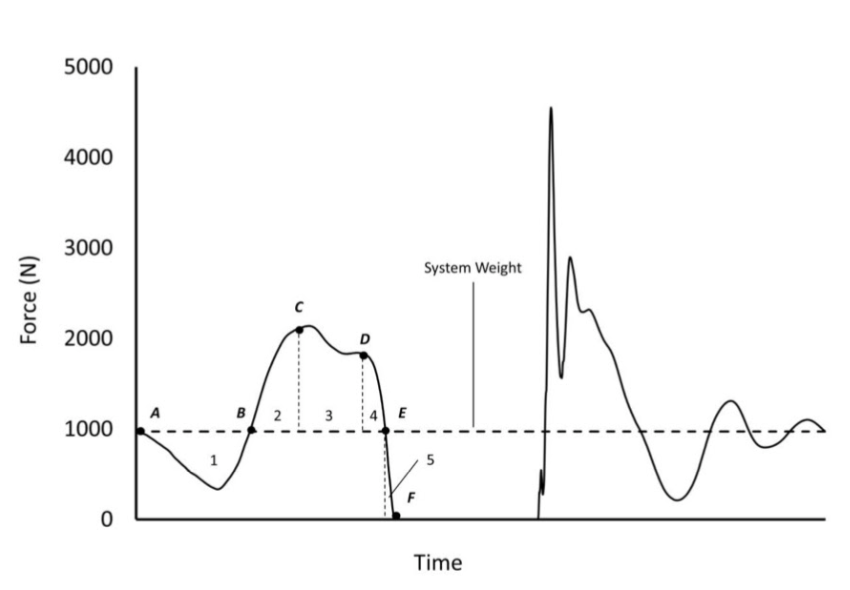
- Point A to B: This is the unweighting phase and where the athlete begins the countermovement portion of their jump.
- Point A to C: this is the “Stretching phase” or the entirety of the countermovement. At point C the athlete is at the bottom most point of their countermovement, and this ends the eccentric phase of their jump. Point C is where the concentric (upward drive) phase begins. Furthermore, the slope of this phase details for us the rate of force development during a jump. RFD is vital to athletic performance.
- Point C to D: This period of time is the net impulse phase and is directly responsible for determining the height of the jump of the athlete. Impulse is defined as force production over a given timeframe.
- Point E to F: This is the deceleration-propulsion phase of the force-time graph. This phase happens directly before the athlete leaves the force plate, which happens at point E.
- Point F: This is the flight phase of the jump, and the athlete has left the force plates.
- Immediately upon landing is the highest ground reaction force peak, which encompasses the loading zone. This is the peak landing force that the athlete experiences upon returning to the force plates after their jump.
All of these elements combined can give us a window into the athlete’s CNS proficiency and efficiency, and if using a dual plate system can show any underlying aberrant performances that could negatively impact performance via asymmetry. For our purposes we test the CMJ by itself as well as in series where 3 jumps in a row are performed with minimal time in between. The later, where 3 jumps in a row are tested, gives us a metric that can be used to quantify the athlete’s SSC efficiency called reactive strength index or RSI.
RSI Primer
The reactive strength index allows for practitioners to quantify the athlete’s ability to transition from eccentric to concentric force production within the context of a plyometric activity (2). Using force plates this metric is calculated by dividing the jump height by the ground contact time (1). Once this number is calculated it can be compared to the chart below to determine the athlete’s performance, and furthermore to laser-guide the training prescription the coach employs.

RSI for Repeat CMJ vs RSI for STJ Testing
For our second and third jumps to be tested we will collect an RSI reading, which as stated previously can give us a window into the athlete’s current status and allow for a bespoke training plan to be created to promote even greater adaptations to the desired stimuli. RSI can be determined from the repeat CMJ and also the STJ jumps, RSI mod for a regular CMJ. The rub lies in that each jump can elicit an RSI number, but it can give you two different pieces of information.
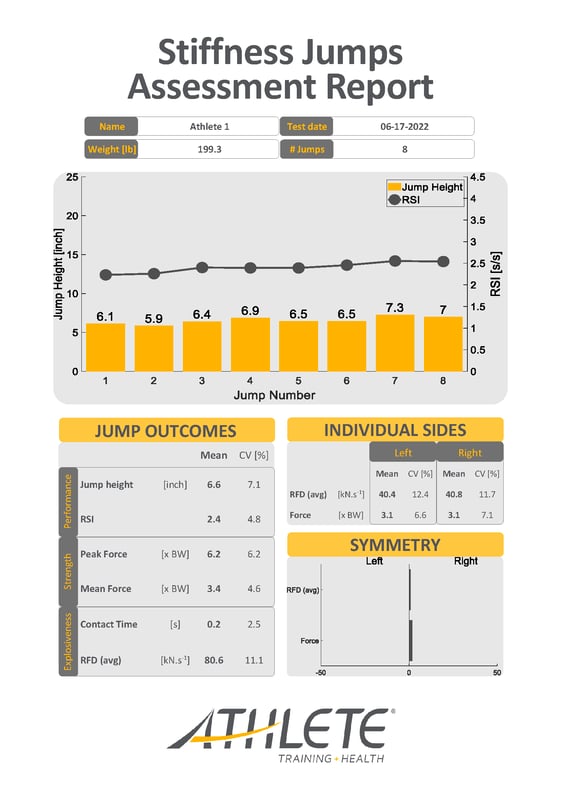
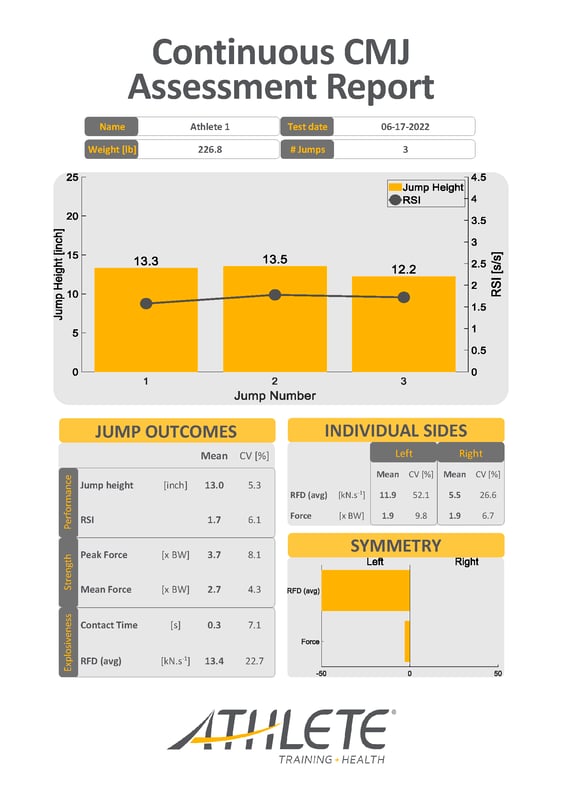
First let’s define the two tests that we are using to establish the RSI numbers we will be comparing. We will be using the repeat CMJ, where 3 jumps are performed in succession with as little time separating jumps as possible. The second jump is our stiffness test (STJ) where a series of 7 pogos are performed with legs stiff, focusing on the shortest amount of ground contact possible. To calculate the RSI for the STJ test we take the 3 best jumps from the series and average them out.
Now that we have an understanding of the two primary movements used, let’s briefly discuss the difference in RSI between the two, because they are different. As we established prior, the CMJ is a measure of the slow SSC, so If we pull apart lRSI for the repeat CMJ test we can posit that it will give you an indication of CC and PEC functionality. While the RSI number for the STJ testing will tell you how well the SEC is functioning. A simple way to think about this, is that the ballistic nature of the pogos during this test elicits such a short ground contact time that the muscle and fascia do NOT have time to contract, therefore the tendon has to take up the slack here. So in short, the repeat CMJ RSI gives an idea of the muscle and fascial system’s function with regard to the stretch shortening cycle, whereas the STJ RSI is a measure of the reactive ability of the tendinous structures.
Practical Application
Once all of this information is present we can really focus on the low hanging fruit. We can take all of this information into consideration and make informed decisions that can guide the programming decisions for that particular athlete.
Harkening back to the CMJ test, we can parse out the athlete’s proficiency in jumping tasks and their basic rate of force development, and their ability to dissipate force upon landing. Decrements in either of these will steer our decision making process.
We can compare the RSI metrics from the repeat CMJ and STJ tests and determine which type of jump we need to emphasize more of in order to create a more balanced athletic profile if that’s the goal. If the athlete’s sport requires one quality in greater quantities we can start to emphasize one type of jump over the other in order to further amplify the quality that is most pertinent to the maximization of performance.
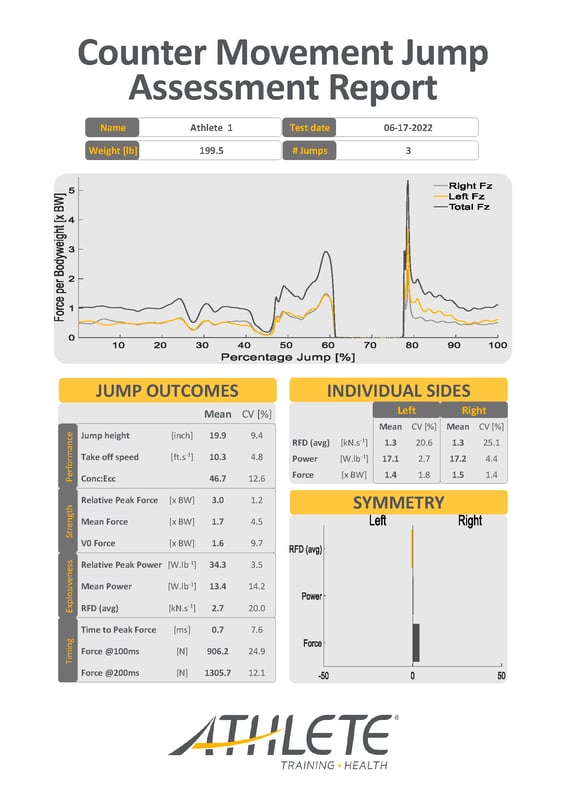
Report Examples
References:
1. Patterson, M., & Caulfield, B. (2010). A method for monitoring reactive strength index. Procedia Engineering, 2(2), 3115–3120. https://doi.org/10.1016/j.proeng.2010.04.120
2. Flanagan, E. P., Ebben, W. P., & Jensen, R. L. (2008). Reliability of the Reactive Strength Index and Time to Stabilization During Depth Jumps. Journal of Strength and Conditioning Research, 22(5), 1677–1682. https://doi.org/10.1519/jsc.0b013e318182034b
3. Sole, C. J., Mizuguchi, S., Sato, K., Moir, G. L., & Stone, M. H. (2018). Phase Characteristics of the Countermovement Jump Force-Time Curve: A Comparison of Athletes by Jumping Ability. Journal of Strength and Conditioning Research, 32(4), 1155–1165. https://doi.org/10.1519/jsc.0000000000001945